Linear regression may be the most basic and accessible machine learning (ML) algorithm, but it’s also one of the fastest and most powerful. As a result, professionals in business, science, and academia frequently rely on this widely used method for predictive analysis. Understanding how linear regression works, its types and attributes, its key benefits, and its main applications across various fields can help you make the most of it in your business.
KEY TAKEAWAYS
- •Three types of linear regression include simple (single), multiple, and polynomial regression. (Jump to Section)
- •Linear regression is used across various fields, from business and economics to healthcare and the social sciences. (Jump to Section)
- •Effective methods are available to address the common challenges of using linear regression models. (Jump to Section)
TABLE OF CONTENTS
What Is Linear Regression and How Does it Work?
At the most basic level, linear regression relies on one variable—the independent variable—to predict the value of another variable: the dependent variable. This straightforward formula for making accurate predictions enables highly explainable artificial intelligence (XAI) that can be trained quickly.
It originated in the development of statistical methods for analyzing human measurements pioneered by Victorian-era naturalist and behavioral geneticist Sir Francis Galton. In studying the relative heights of fathers and sons, Galton observed that offspring tended to deviate less from the population’s mean height value when compared to their parents, even as taller-than-average fathers typically produced taller-than-average sons.
This statistical phenomenon—the “regression to the mean”—dictates that when a random variable’s sample value is extreme, subsequent samples of the same random variable will fall close to the population’s mean.
How Linear Regression Works
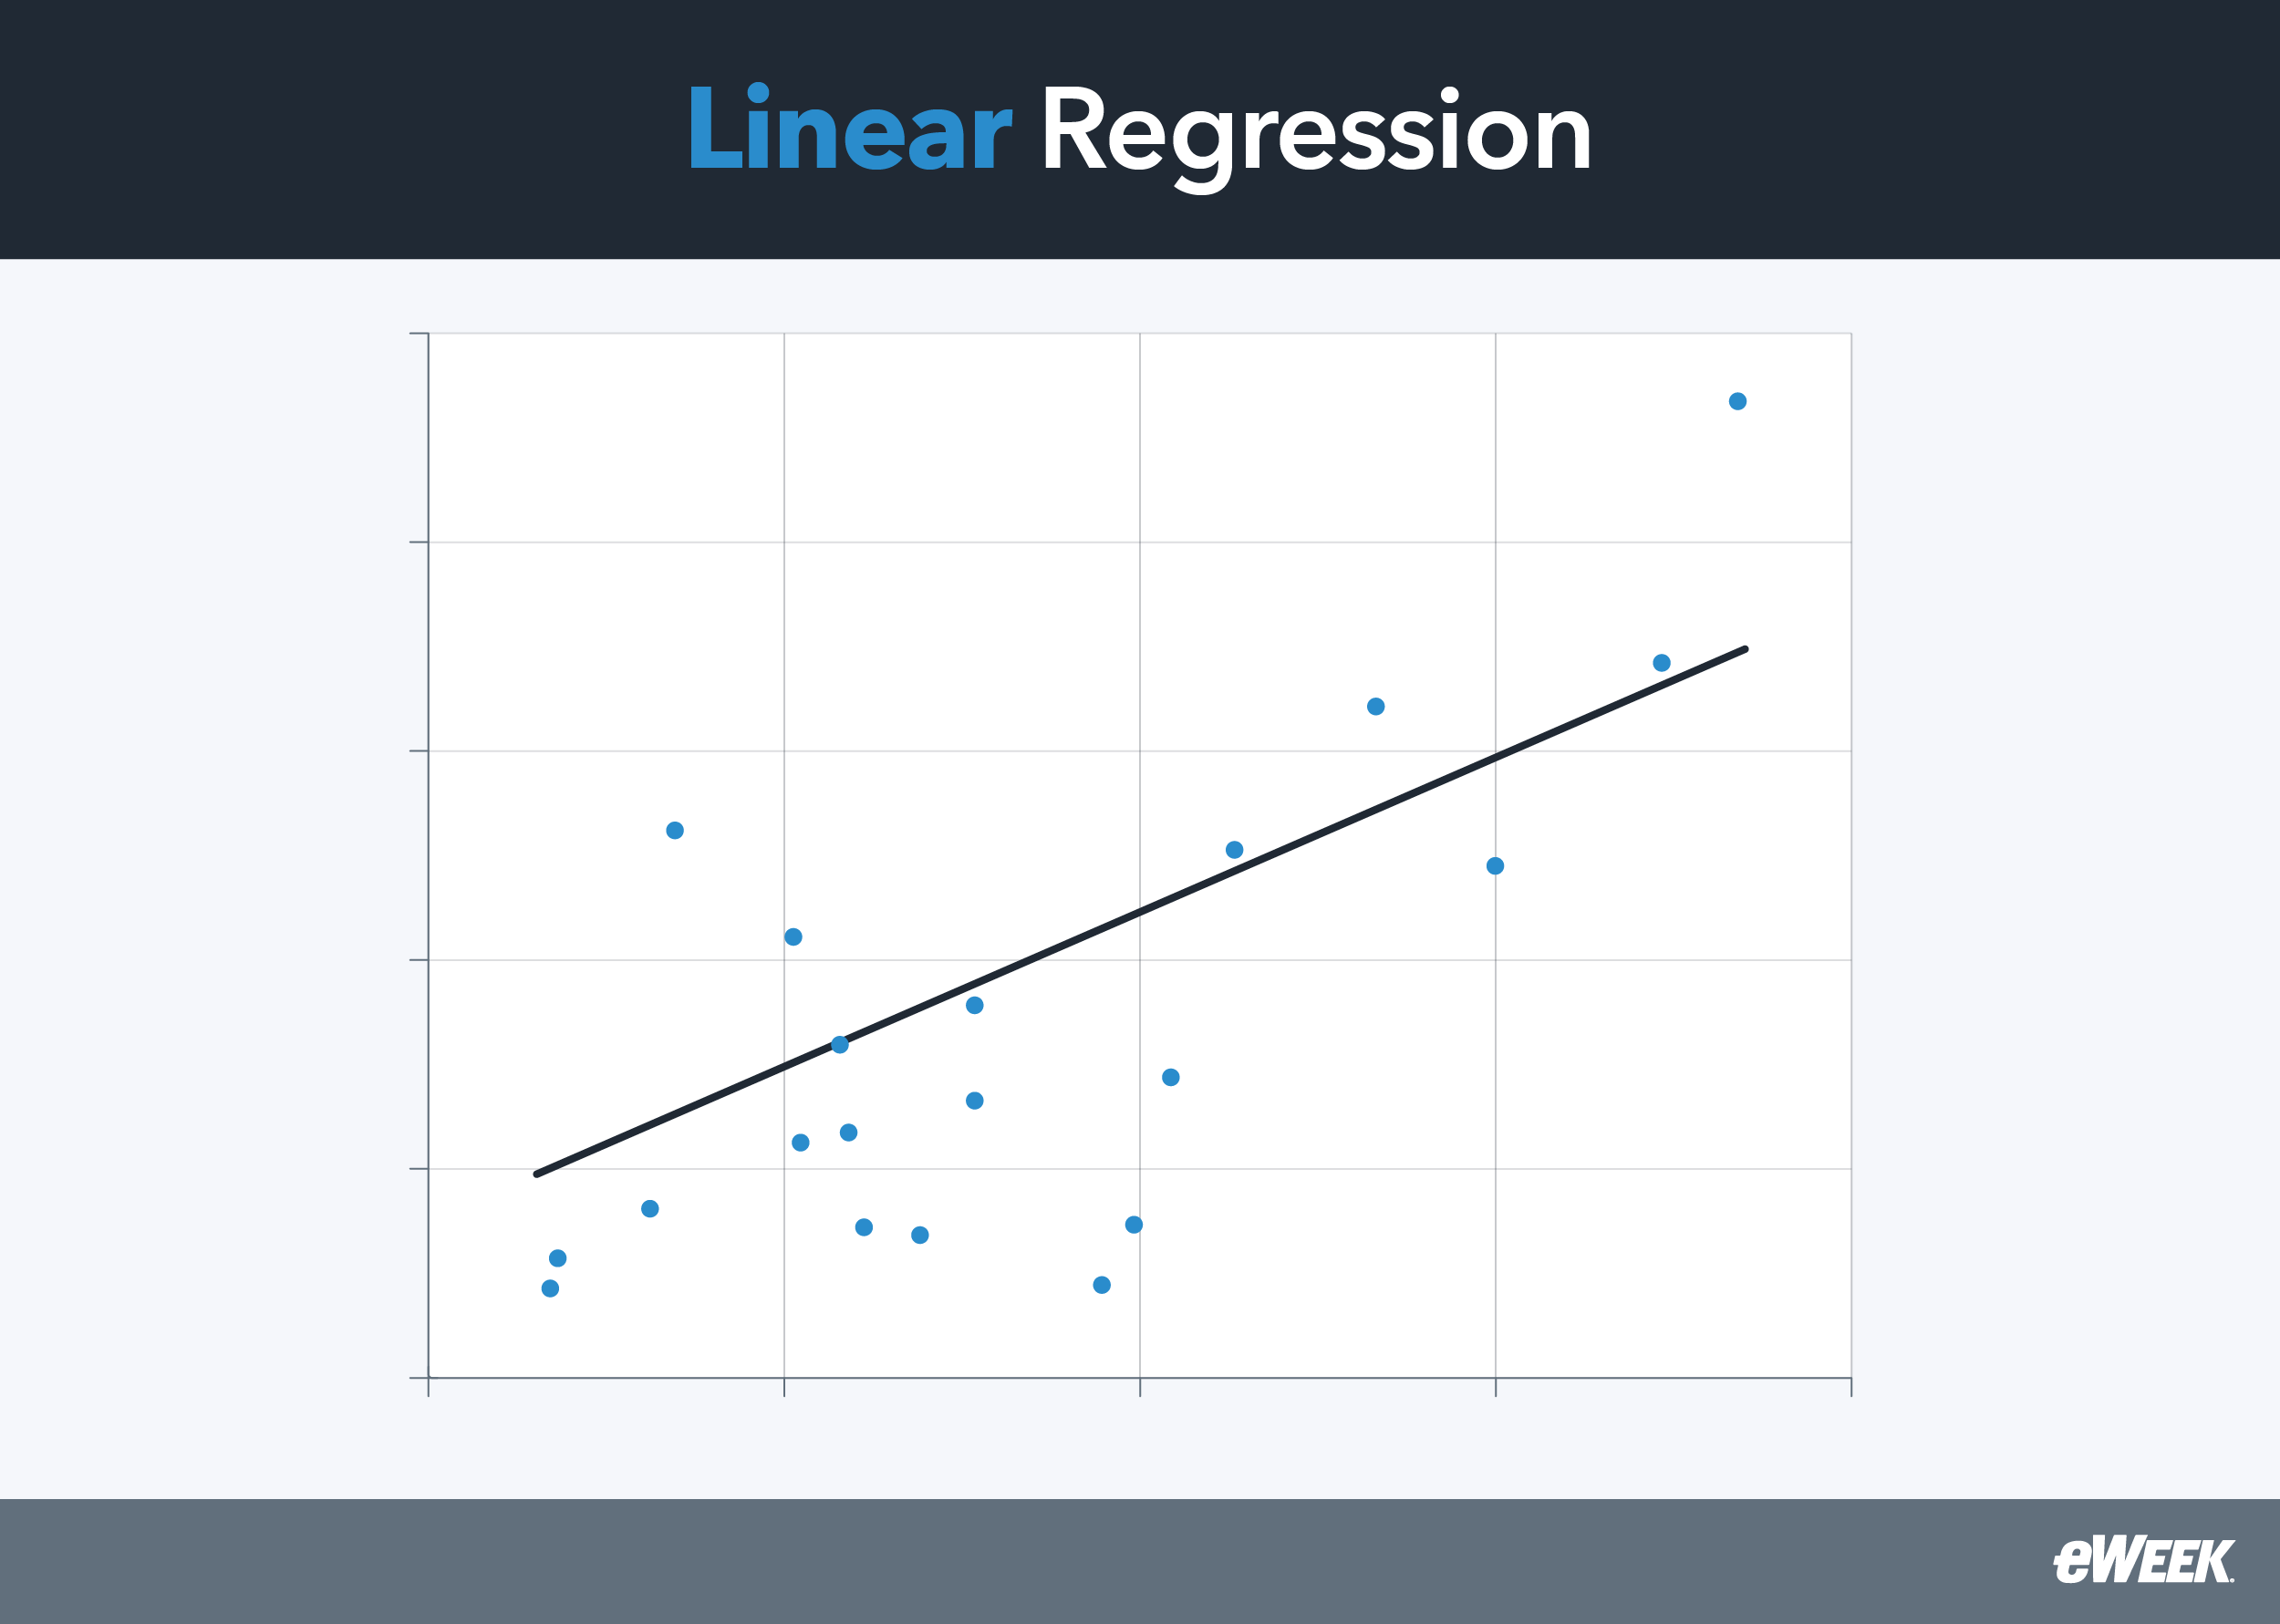
Linear regression works on the assumption that when extreme outcomes are observed in random data samples, more normal data points are likely to follow—and that a straight line can fit between the plotted data points. This line can be used as a reference for minimizing predicted and actual output value discrepancies. Further, statistical methods can be derived from regression analysis to estimate relationships between dependent variables and one or more independent variables.
The regression to the mean phenomenon applies to virtually any measurable parent-offspring attribute. Statisticians recognize it as a mathematical fact of natural variation in repeated data and rely on this premise to minimize unexpected differences in predicted and actual output values.
Independent and Dependent Variables in Linear Regression
In regression analysis, the outcome variable is the dependent variable, and the confounding variable is the predictor or independent variable. In simpler terms, the independent variable X is the cause, and the dependent variable Y is the effect. For example, the observed data in Galton’s research seemed to imply an association between two variables—a father’s height and his son’s height—so a tall father’s height (X) would be generally expected to result in a tall son’s height (Y).
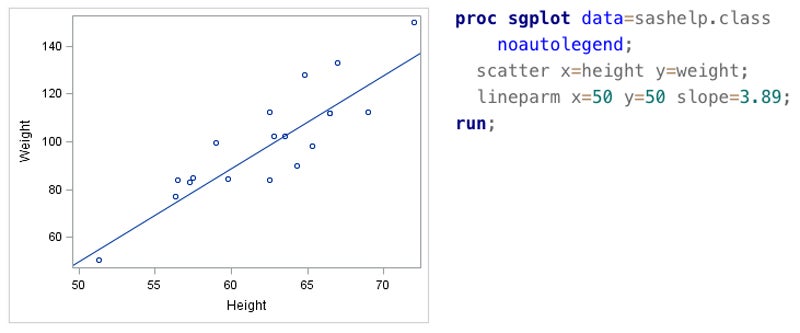
In a linear regression plot, the straight line represents the best attempt to minimize the residual sum of squares between known or observed data points and the predicted data points. For this reason, the regression line is also referred to as a best-fit line, and the method used for this fitting technique is called the least squares method.
Understanding the Correlation of the Variables
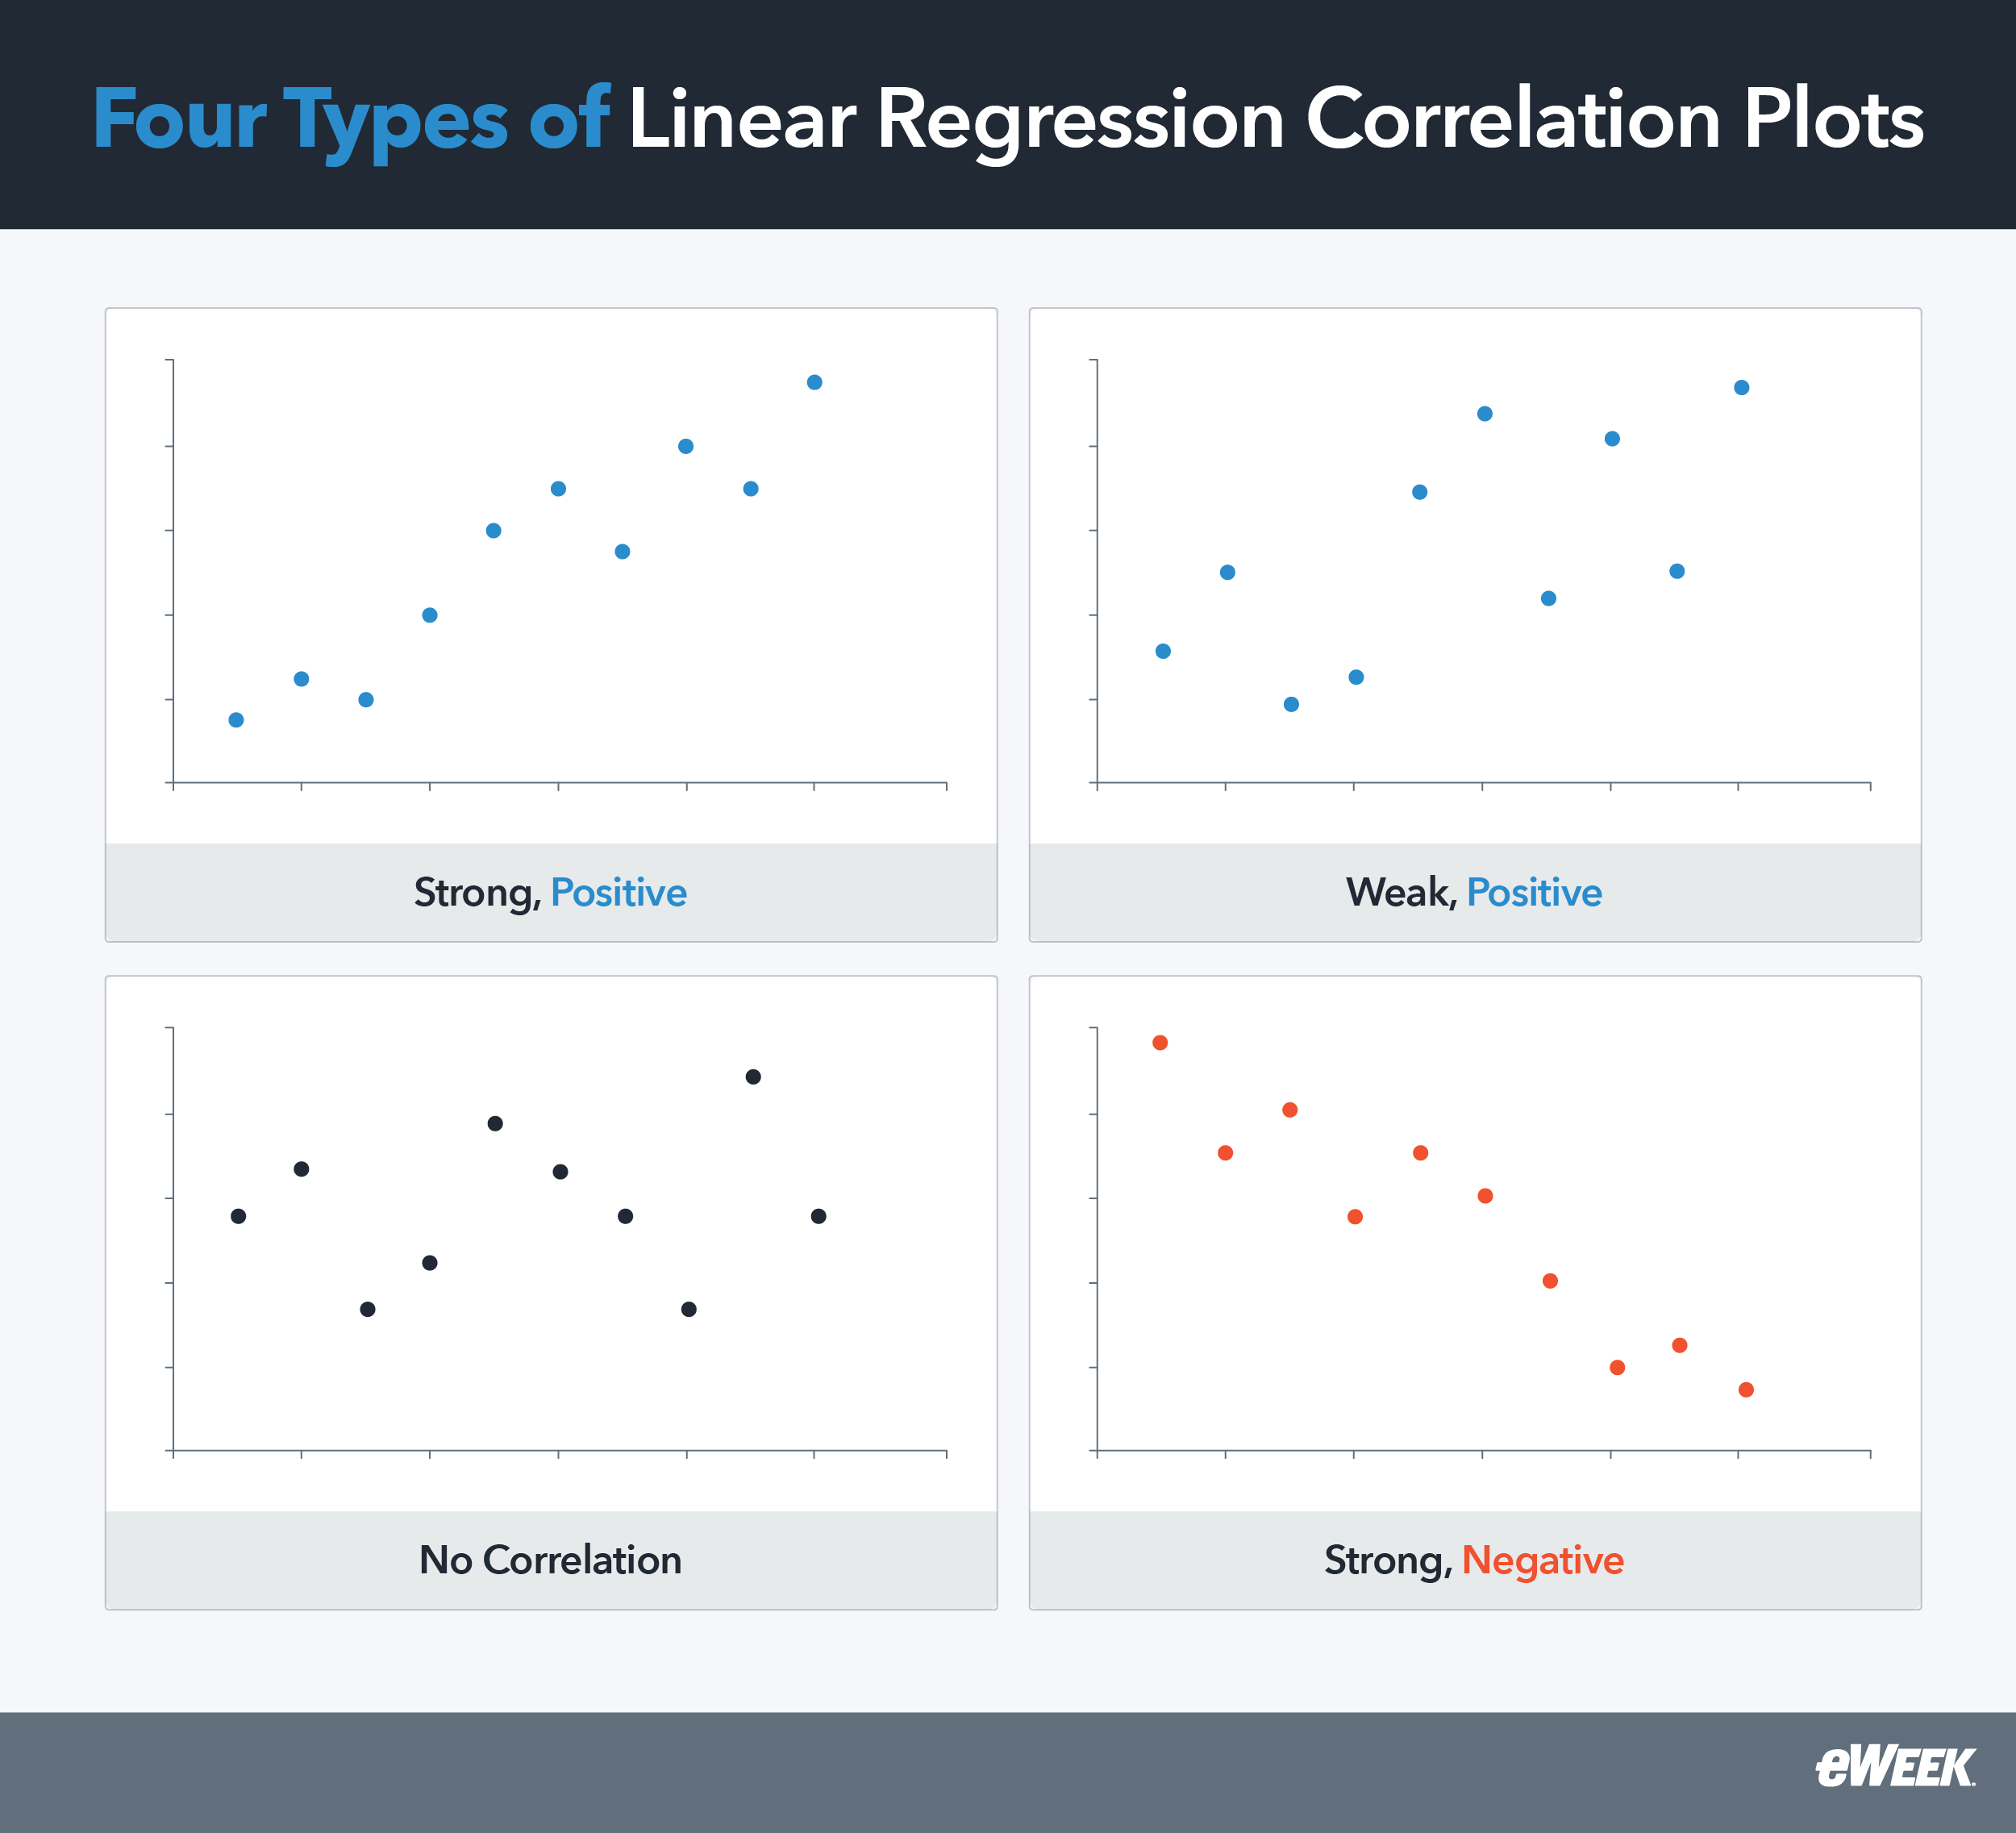
The regression line indicates where the mean data points are expected to fall. By analyzing the line’s direction and the spread of data points around it, you can make inferences regarding the association between the variables. The figure below depicts the primary four scenarios in which a continuous variable is plotted on the X-axis and the other on the Y-axis.
Scenario 1 depicts a strong positive correlation between the X and Y variables, while scenario 2 depicts a weak positive correlation. In both cases, the regression line is oriented from left to right upwards. Galton’s observations are an example of positive correlation—an increase in the father’s height is correlated with an increase in the son’s height. Scenario 3 illustrates a lack of correlation between the X and Y variables. In this case, the regression line is horizontal. Scenario 4 illustrates a strong negative correlation, with a regression line oriented downwards from left to right. For example, the number of hours spent exercising may be negatively correlated with weight since an increase in exercise could result in weight loss.
Estimating Coefficients and Predicting Values
The equation y = mx +b represents the most basic linear regression equation:
- x is the predictor or independent variable
- y is the dependent variable or variable to be determined
- m is the estimated slope of the regression line
- b is the estimated intercept where the regression line crosses the y axis when x is set to 0
In this basic linear regression equation, determining m would tell you the rate of change between x and y; m is defined as the main regression coefficient or unknown parameter describing the relationship between x and y. In other words, if you know the value of m, you can predict the value of y using a known x value.
Four Types of Linear Regression
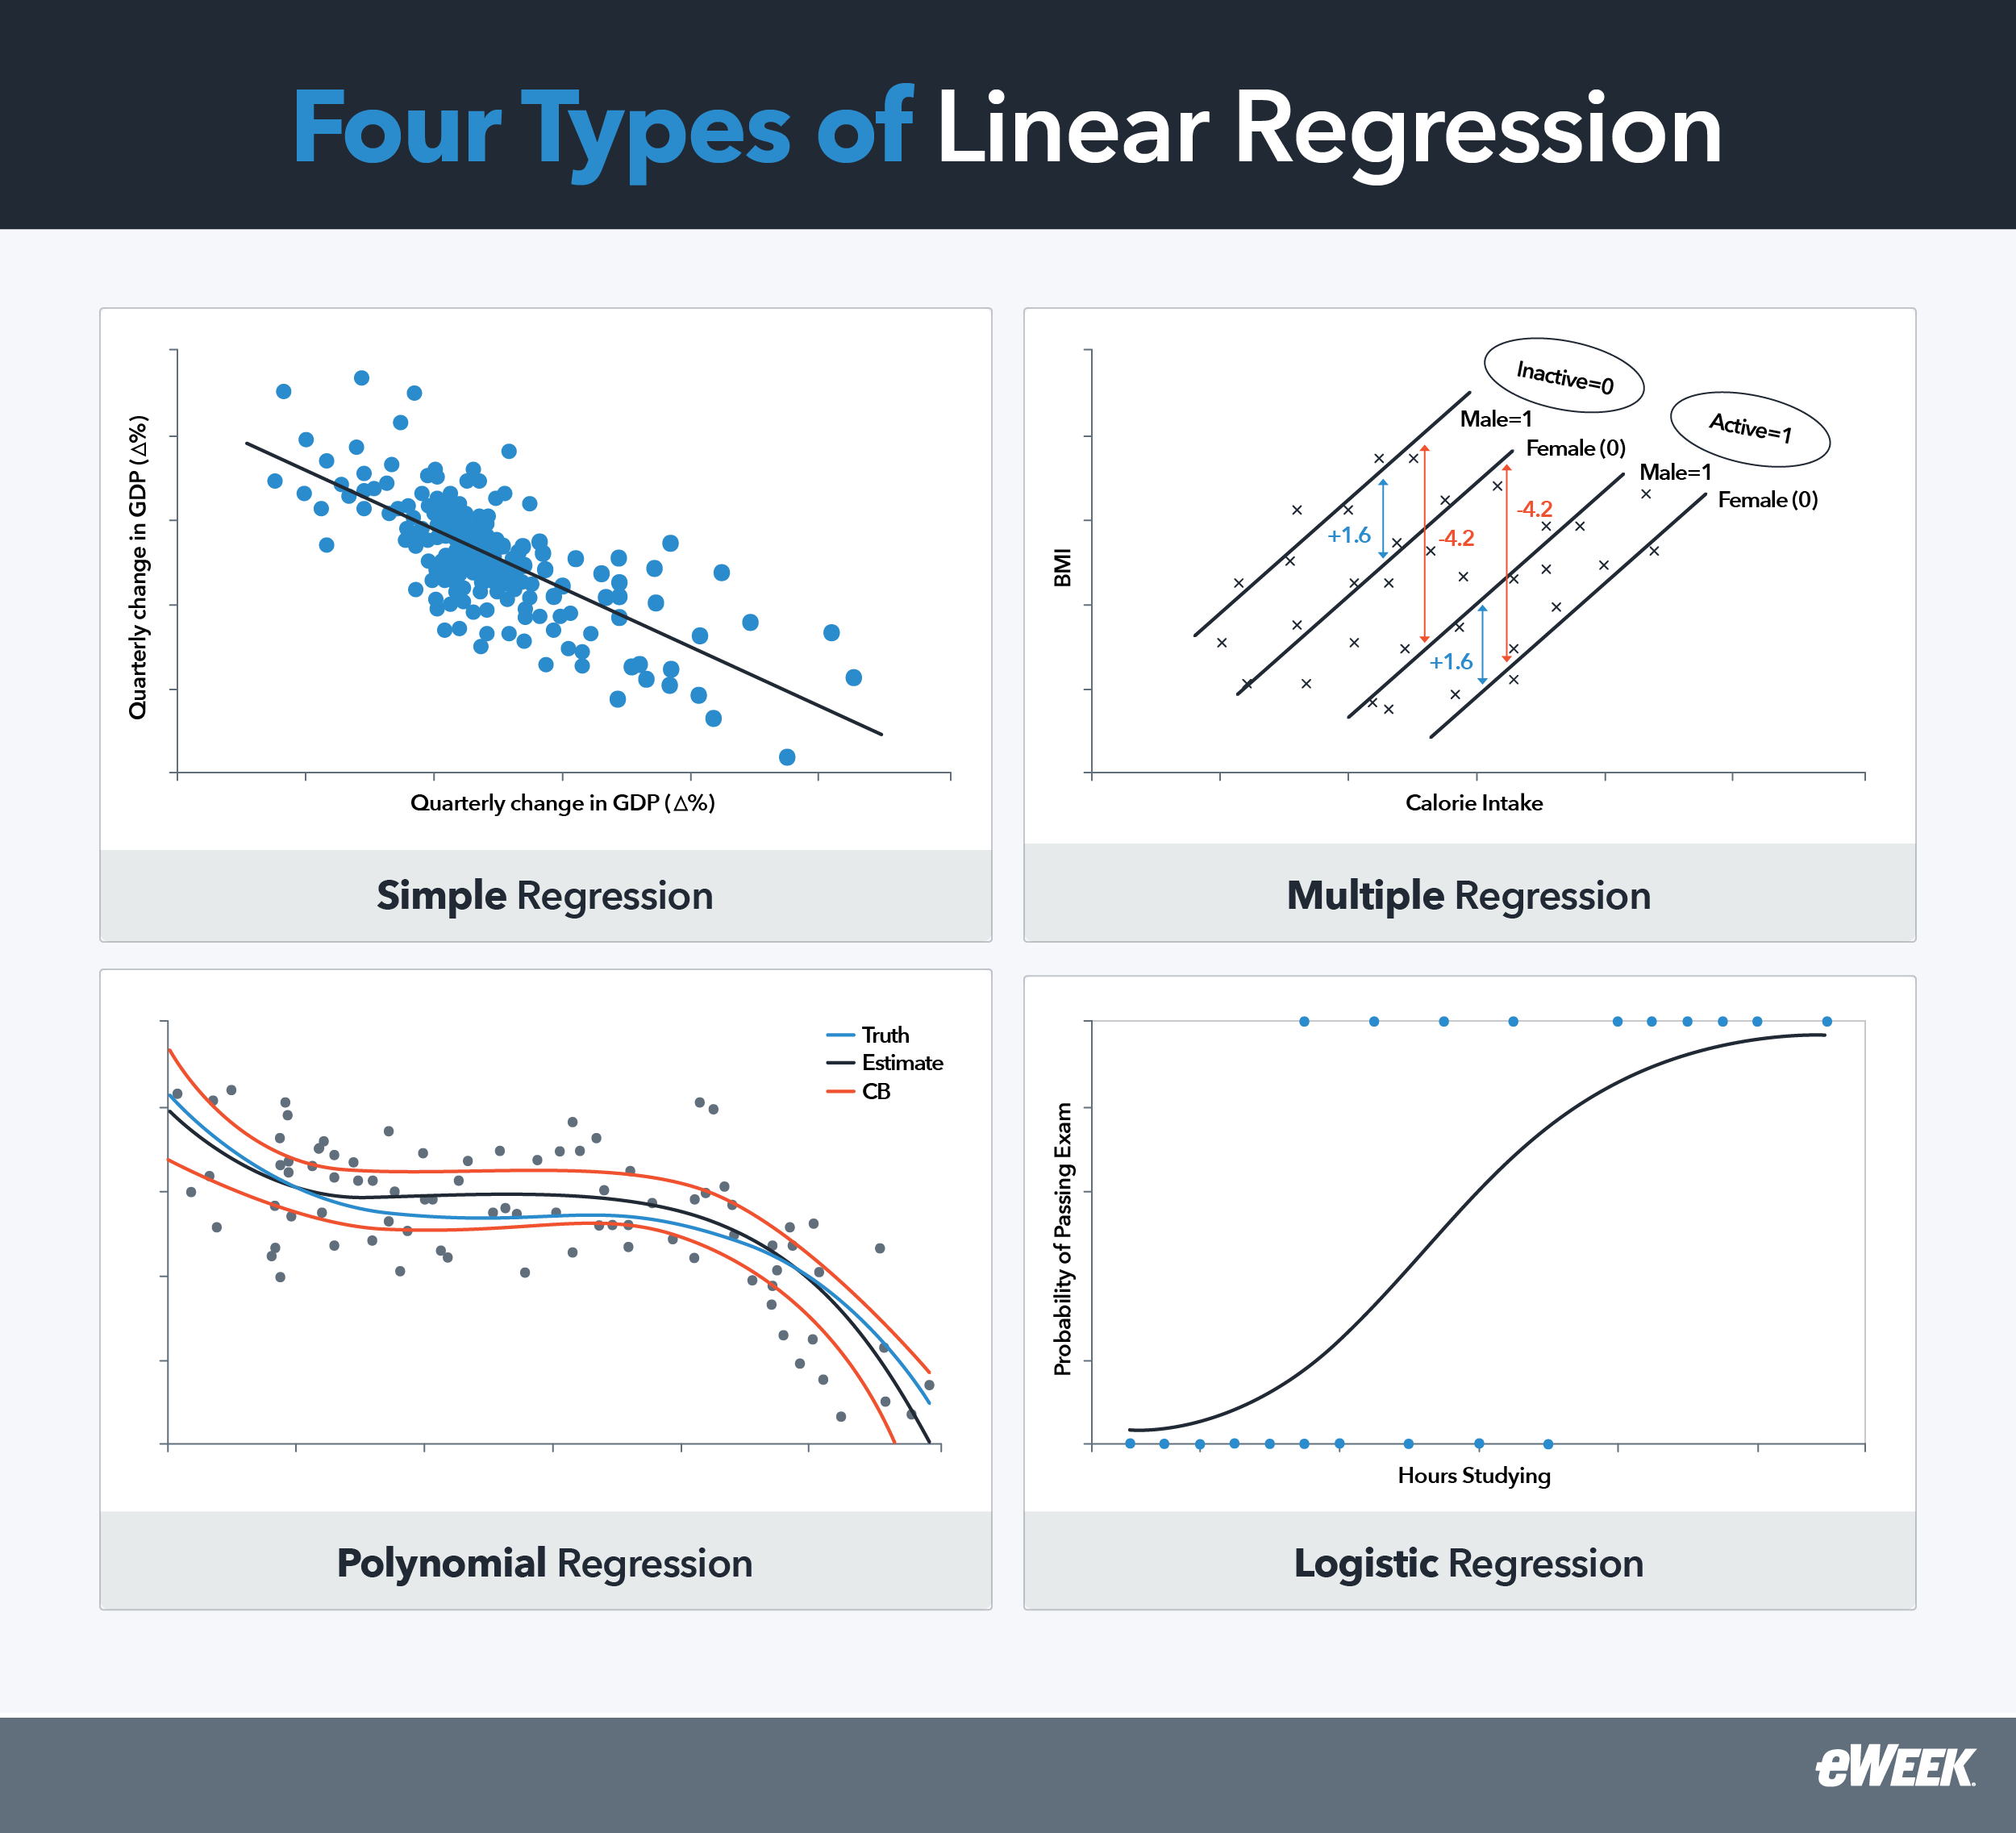
The four most common types of linear regression are simple, multiple, and polynomial. Understanding their differences can help you determine which approach best suits your needs:
- Simple Linear Regression: The most basic linear regression model describes the correlation between an independent and dependent variable using a regression line to convey the linear relationship between the two variables.
- Multiple Linear Regression: Multiple linear regression describes the correlation between two or more independent variables and a dependent variable, also using a straight regression line.
- Polynomial Regression and Other Variants: Polynomial regression conveys the relationship between the dependent and independent variables as an nth degree polynomial—for example, ax². In this form, the regression line is curved rather than straight.
- Logistic Regression: Logistic regression uses the independent variables to estimate the probability of an event occurring (either 0 or 1). Instead of predicting a continuous quantity or number, this type of regression analysis categorizes input data into predefined groups or classes. As its name implies, logistic regression uses logarithmic functions to calculate the regression line.
Key Assumptions and Limitations of Linear Regression
Linear regression works on several assumptions that serve as guidelines for its capabilities. In many cases, you can recognize model assumption violations easily by applying various plots and visually inspecting them. For example, you can check for linearity by observing the regression plot—if a curve is noticeable, the relationship between the variables may not be linear. You can also detect dataset outliers by just looking at the plot of the dataset if the plot is small.
Other model assumption violations may require more visual analysis or different plot types to detect. For example, to check for homoscedasticity, you can plot residuals versus fitted values—if the residuals fan out or in to show increasing or decreasing speed, the dataset is probably not homoscedastic.
Linearity and Independence of Observations
Linear regression presumes the existence of a linear relationship between the independent and dependent variables. Data professionals typically make this determination by using a scatter plot—an arbitrary collection of x and y data points—to see if the data falls along a straight line.
Homoscedasticity and Normality of Residuals
Linear regression also presumes that variances in different groups being compared are equal or similar. This is essential to ensure the accuracy of the regression analyses. To measure prediction accuracy, data professionals use the normality of residuals—that is, they measure the difference between the observed data and the predicted value to ensure that they are normally distributed.
Lack of Multicollinearity
Multicollinearity is a problematic situation in which the independent variables in a regression model are correlated. When the independent variables in a linear regression are highly correlated, model fitting issues and predictive errors can occur—essentially, the standard error of the coefficients will increase.
Non-Linear Relationships
Logistic regression was introduced earlier as a way to predict class membership; to do this, models must be fitted to capture curvature in the datasets. Applying logarithmic, square root, or reciprocal transformations to the independent and/or dependent variables effectively changes the prediction from continuous to discrete values.
Outliers and Anomalies
Any sizable dataset is bound to have outliers and anomalies. Although the initial inclination is to remove them, refrain from simply discarding them if they cannot be attributed to an error. Removing them can unnecessarily introduce bias into your data science and make your predictions less accurate. Instead, handle outliers with methods such as quantile-based flooring and capping—which caps outliers at a certain value above the 90th percentile value or floors them at a factor below the 10th percentile value—or mean/median imputation, which replaces the outliers with the median value.
Linear Regression Applications Across Various Fields
Businesses in many industries use linear regression for a wide range of applications. Here are some of the most common:
- Predicting Sales and Market Trends: Forecasting in business and economics involves using linear regression to analyze dependent and independent variables for predicting future sales numbers.
- Analyzing Disease Patterns: Healthcare practitioners use linear regression to determine relationships between patient factors and disease outcomes to improve patient care and clinical practice. For example, clinicians can predict the length of a patient’s hospital stay based on clinical measurements, treatment data, and patient demographic data.
- Understanding Behavioral Trends: In social sciences and education, linear regression is commonly used to understand cause-and-effect relationships in societal/demographic groups, learners, and media consumers. For example, researchers can use linear regression to analyze social media trends, relationships between different variables, and their effects on human behavior—for example, number of hours spent online and job satisfaction levels.
Software for Linear Regression
The market is filled with tools and AI-driven software that can help you perform linear regression analysis on data and visualize it for easier comprehension. We recommend Alteryx, IBM SPSS, and SAS.
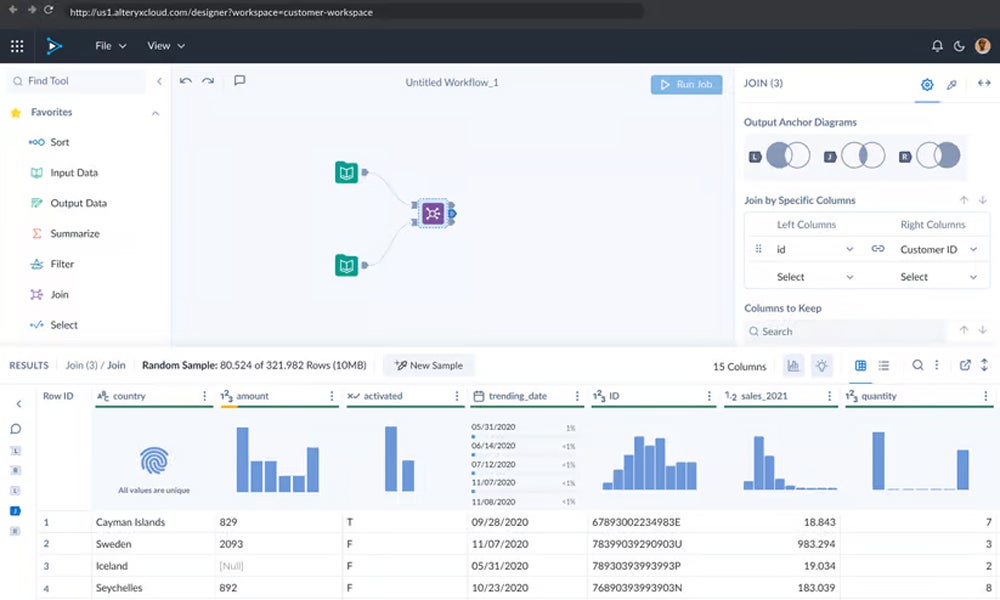
Alteryx
Alteryx is a popular AI analytics platform used by data professionals to quickly access, manipulate, analyze, and output data. The company’s Designer platform provides a linear regression tool to create simple models for estimating values or evaluating relationships between variables based on their linear correlations. Alteryx’s Designer Cloud platform starts at $4,950, while the Designer Desktop starts at $5,195.
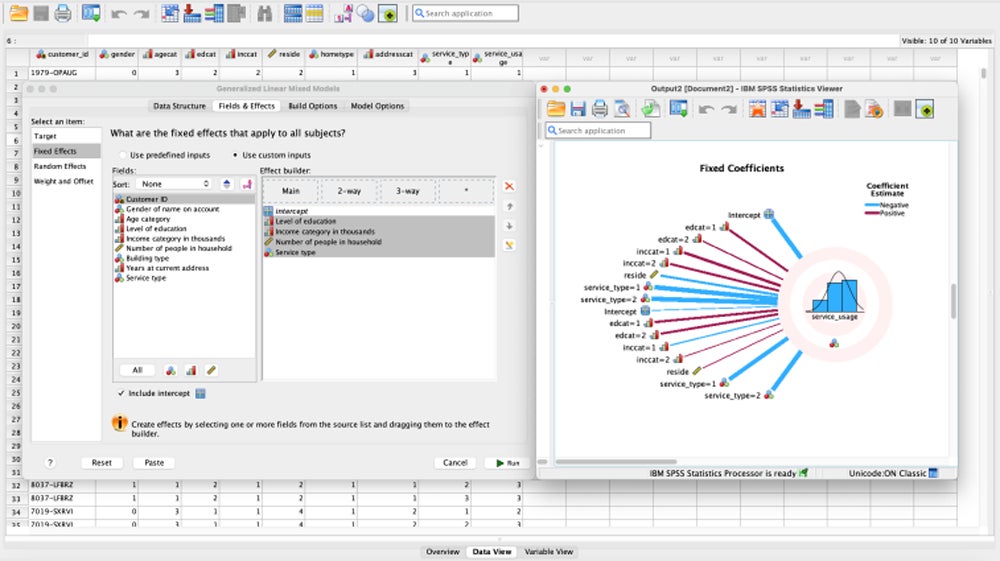
IBM SPSS
IBM SPSS has been a long-standing favorite among data professionals for running statistical analyses and multivariate statistical techniques like linear regression. The SPSS Statistics software package enables users of all experience levels to perform advanced statistical analysis. Pricing depends upon features and users, but the base subscription starts at $1,069 per year for one user.
SAS
Along with IBM SPSS, SAS is another well-established juggernaut in statistical analysis and data analytics. The SAS system provides many regression procedures, such as the REG for general-purpose regressions. The company does not publish prices, but reported ranges vary widely based on features, users, and add-ons.
Common Linear Regression Challenges and Solutions
Linear regression is a complex process that can yield many positive results, but it can also pose challenges for those who want to implement it. Here’s a look at the most common challenges and some solutions.
Addressing Overfitting and Underfitting
Overfitting occurs when a model is too complex with superfluous parameters and a sample size too small for meaningful predictions. This results in ML models that don’t generalize well to new data. The most straightforward way to mitigate overfitting is to simply acquire more data to improve model accuracy. In contrast, underfitting occurs when the ML model is not complicated enough and is unable to find relationships and patterns in the data. In these cases, you can increase the model complexity by increasing the number of features in the dataset.
Combining Statistical Methods
For some data analysis use cases, you’ll need to predict a continuous quantity or number and discrete class membership. In these scenarios, a common approach involves developing both a linear regression model and a logistic classification model with the same dataset and deploying them sequentially. Alternatively, you could develop a multi-output model—a single neural network model for predicting both a continuous quantity and a class-based label value from the same input.
Enhancing Predictive Models
Although linear regression is known for its simplicity and interpretability, it can also become complex and unwieldy when incorporating multiple predictors to capture complicated relationships. This could result in overfitting and compromise your model’s ability to generalize to new data. To mitigate these issues and enhance your predictive models, you can use regularization techniques like Ridge or Lasso regression to improve performance, address overfitting, and ensure that your linear regression models remain robust and generalize well to new data.
Improving and Validating Your Models
As with all predictive models, your linear regression models should be constantly evaluated and adjusted to ensure your predictions remain accurate. You can assess the performance and effectiveness of your regression model by using various quantitative measures and evaluation metrics. By using evaluation metrics such as mean absolute error (MAE), mean squared error (MSE), root mean square error (RMSE), mean absolute percentage error (MAPE), and symmetric mean absolute percentage error (SMAPE), you can effectively measure the numerical distance between your actual and predicted values.
Bottom Line: Unleash the Power of Linear Regression
Linear regression is a straightforward, reliable approach to predictive analysis that continues to serve as a cornerstone of modern data science and AI/ML. Despite the wide array of powerful ML developments and techniques in recent years, data practitioners rely more on this simple and proven technique for making predictions.
Learn more about the large language models driving artificial intelligence with our guide to LLMs.